FAQ about Sille.Space
Do you have some kind of data quality control?
Yes. We have specified internal data quality control processes and each analysis will be controlled by our experts before we open the results for clients.
My object is not covered evenly with measurement points. Why is that so?
Our service does not guarantee even coverage of points within object boundaries due to reflective properties. Some parts of the object may be blocked by other objects or do not have sufficient stable reflectors. If the coverage is drastically uneven we will notify the client. This is looked at on a case by case basis.
Is it possible that temperature effects the deformation data?
Yes. We have seen from time series analysis that metal structures expand and shrink with hot and cold temperatures. Our algorithms, however, use temperature data and take this into account when calculating deformation.
For those objects it is correct to look at deformation data during similar temperature conditions.
Can Sille detect all possible hazards for potential collapse?
No. Hazards like earthquakes and collision damage happen in a very short timeframe and therefore can't be monitored on a bi-monthly or monthly basis. Sille is excellent for monitoring changes that can occur over a longer period of time.
Additionally, hazards such as a temporary heavy load, temporary pressure, stong mechanical pressure or other forces that occur quickly in a short period of time can't be monitored using Sille.
Can I monitor my active construction site for deformation?
No. During active construction the reflective properties of the object are changing constantly so no stable reflectors can be found. A historical time series can also be interrupted if construction or repairs have taken place on objects being monitored.
If there are some objects on the site that are not being actively constructed they can be successfully monitored, as well as sites around an active construction site to ensure stable surroundings.
Can I measure the deformation of constantly moving objects? For example, my camping trailer, a suspension bridge, or a floating object?
No. Because of the constant moving on these objects there are no stable reflective locations over long time periods.
Objects such as suspension bridges and floating piers are very hard to monitor using SAR and will be examined on a case by case basis.
We can detect just a location for such object.
What is the geographical point accuracy on the map?
The location accuracy on the X and Y axes is 5 meters (16.4 feet) to 20 meters (65.6 feet) because the point location within the pixel can not be accurately estimated. This does not effect deformation measurements.
The location of the point on the map is indicative and can be very close to the actual location.
Considering the object size, is it possible to measure small objects?
Small objects (under 100 m2 or 1076 sqft) are difficult to monitor and should have at least one strong reflector in the area. We will notify the client if the area is too small.
What can I interpret from the results if my object is covered only by one satellite viewing angle?
If an object is covered by only one satellite viewing angle, the same information and action can be inferred as that of a dual viewing angle. The only limitation is if the object is not visible from that angle (blocked by something) resulting in no points. Usually strong clear deformation is visible form one viewing angle as well.
Can the system detect deformation for every direction and any location on earth?
The service does not guarantee north faced deformation data because of satellite limitations. We also can't assure deformation measurements for all objects on X, Y and Z axes due to satellite data coverage. All locations on Earth are not covered with dual orbits (ascending/descending). This information will be available for the client.
For all objects that meet the criteria, the service offers at least one LOS (line of sight) deformation detection and monitoring. Objects that are completely blocked by higer objects (mountains, tall buildings, forest) can not be monitored because there is no straight visibility towards the satellite. For some cases, it is not possbile to correctly estimate deformation for objects that are located in secluded places and do not have any good reflective objects nearby. To correctly estimate deformation, it is necessary to have some reference objects nearby, these are commonly man made structures. If there are not any reference objects nearby (within 10km or 6.2 miles), it may be impossible to measure deformation. This will also be looked at on a case by case basis.
The service does not ensure a certain number of points as the amount can vary depending on reflective properties of the object. In this event the client will be informed.
Small objects (under 100m2 or 1076 sqft) are difficult to monitor and should have at least one strong reflector in the area.
What happens if three of my interested objects are near each other? Can Sille still measure the deformation for each individual object?
If the objects are within one pixel (data resolution is 5 meters x 20 meters (16.4 feet x 65.6 feet), they can not be distinguished from each other. The reflective signals within one pixel summarize and it is not possible to derive deformation measurements for single objects within on pixel. We can measure the overall deformation of objects in the pixel, and in most cases this is sufficient for correct estimation. The method calculates the deofrmation based on the strongest reflector which dominates within the pixel.
From our experience analysing many objects we know that if there is deformation within one pixel, most likely all the objects within the pixel act the same way - they're deforming.
Can I order Sille for my newly built infrastructure object?
The minimum age of objects (time from the last construction/repairs) is generally 6 months. If there is 6 months of collected satellite data we can start making the deformation analysis. In some cases, this period can be 3 months, but this will be estimated on a case by case basis. With 6 months of collected data we can assure that there is the necessary amount of quality points.
What can I achieve with artificial corner reflectors?
With artificial corner reflectors it is possible to measure deformation for exact locations as well as for objects that do not have stable points naturally.
What is the difference between deformation and velocity? Why is this information important and usable?
Deformation defines total point displacement during an entire anaysis period. Velocity defines mean displacement per year.
Since analyzed time periods may vary, deformation values can't give an objective overview. The significance of this value depends on time interval length, while velocity is independent from analysis time interval.
Velocity is useful for a comparison of analyses that cover different time intervals. Deformation gives you a better overview of a particular analysis and particular time interval.
Why are the points colored like this?
The colors are selected to represent deformation of the objects. Red is commonly understood as "bad" and suggests negative deformation. Green is commonly understood as "good" and shows no deformation or that the object is stable. Blue does not have common meaning, but is very different from the color red, so is interpreted as an opposite, in our case strong positive deformation or uplift.
What can I interpret from the colorful measurement points on the map?
From the measurement points it is possbile to see how much an area or location on an object has been deforming over the time series. The red and reddish dots show that this specific location has negative deformation and the blue and blueish dots show positive deformation. The green points show that the area is stable. These measurements do not show the deformation trends for the future. To know the current condition it is necessary to regularly monitor the object.
What is the time period from history that you can analyze deformation?
Sentinel's consistent and stable data stream started from January 2015, so we can analyze deformation from Januray 2015 until today and continuing into the future.
How many measurement points are possible to get for my area of intrest?
As the resolution of the data is 5 meters x 20 meters (16.4 feet x 65.6 feet) we can calculate a maxium (in ideal conditions) of one measurement point per 100 m2 (1076 sqft). If the geographical location has acquisitions from both ascending and descending orbits, we can calculate maximum two points per 100m2. So if the area of interest is divided by the data resolution and multiplied by two, you can get the maxium number of deformation points for the area of intrest.
Why do some objects have measurement points but other similar and nearby objects don't have any points?
The precondition for deformation detection is the presence of stable and strong reflectors. Those are usually found on man-made structures and rocky grounds. There are almost no strong or stable reflectors in forests, water, fields, grasslands, swamps, marshes, wetlands etc. There are also no strong reflectors on structuress that are built from wood or other soft materials, or on very smooth surfaces like pavement.
There are many possibilities why some objects do not have stable points. For example, the object angle toward the satellite line of sight, possible repairs, hidden objects, or lack of reflective corners.
Are the points on the map all locations on the object that are deforming and I can be sure that all potential hazards are monitored?
The points are selected by reflective properties and also those that are visible to the satellite. It is possible that there are deforming points that satellite can not detect, because these points are not visible or not stable enough. For this case, we are informing the client, that there are not enough points on the obejct to succesfully monitor deformation. In other cases, if there is continuous deformation pattern on the object, this is visible by many points and can be detected.
Can I add my own data to the map?
Currently this functionality is not open, but if you are interested in adding your own data please contact us.
What size area can be analyzed with Sille?
The minimum area is theoretically 100m2 (1076 ft2) since we can offer a maximum of one measurement point for this area. Practically, we can't guarantee the necessary amount of measurement points for areas under 1000m2 (10763 ft2).
There is no maximum size for an analysis area.
What is the difference between a single analysis and trendline analysis?
We always offer trendline analysis for our clients to ensure maximum accuracy. However in the case of regular data updates, clients can monitor deformation between single acquisitions. Trendline analysis is the deformation analysis based on long time series (20+ images), while a single analysis is a deformation analysis between two consective acquisitions.
What are the plus and minus signs on the lower right corner?
With plus on minus signs it is possbile to configure the colors of the dots, for example, if all deformations under 20mm or 0.8 inch, are not important, the colors can be configured that only bigger deformations are red or blue, values between -20mm or -0.8 inch and +20mm or +0.8 inch are green.
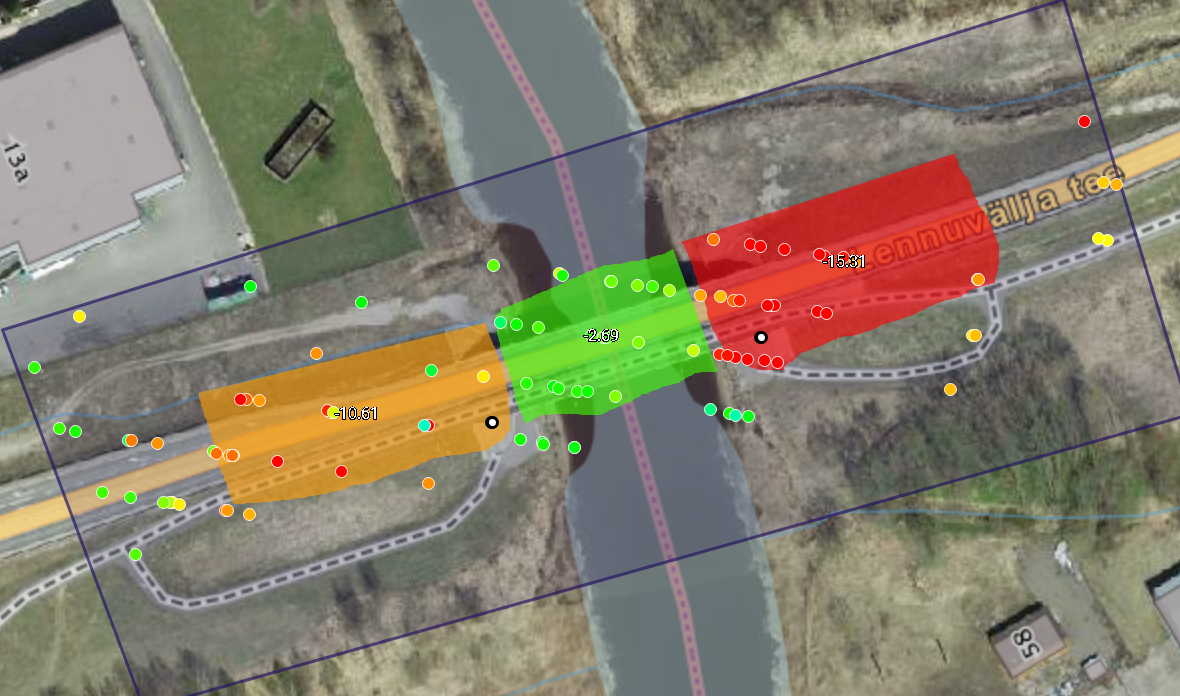
What can I use the area selection and drawing for?
This tool can be used to measure average deformation for a specific area of the object. For example, a bridge can be separated into three parts - two embankments and one deck plate (the part of the bridge which is hanging in the air). Usually deformation for the areas are different. Embankments tend to be deforming more due to soil erosion and deck plates tend to be stable because of the strong pillars. With the area tool, you can separate and investigate the bridge in sections.
Can I change the basemaps?
Usually no. For some countries, like Estonia, we are offering a separate map. If your county has an openly available basemap service, please inform us and we can add this to the selection.
Can I download the point data and use it on some other analysis software or GIS software?
Yes, for registered user, the functionality to download data is avaiable.
What are the dates on the graph?
The dates show satellite overpasses, or acquisitions, for the dates we can detect deformation.
What I can get from the coherence value?
The coherence shows the average stability (quality) of the measurement points over the whole time series, this vale assures the crdeiblity of the measurement. Coherence is estimated in the range of 0 to 1, 0 being no coherence at all, 1 being the aboslute coherence. For man made structures, points that have coherence over 0.7 are stabile enough to succesfully detect deformation values.
What is the meaning of standard deviation and sigma for this dataset?
Standard deviation, or sigma, is the error measurement. The amount which the measured value can differ from the actual value.
What affects the point quality?
The quality is usually effected by material (wood, clay), constant moving of the object (floating piers, suspension bridges), weather (heavy rain, snow, ice), or atmospheric conditions. All these are known to us and our algorithms can recognize the situations. We inform our clients when the issues occur.
Why is the point height (aboslute or relative) negative? I can see from the map that the point is on top of a house.
Sometimes the satellite can't estimate the height correctly. This is due to Sentinel baseline properties and we are actively developing a solution. This does not effect the deformation detection in any way.
How precise are these measurements?
As the Sentinel satellites have a rather small baseline, the height estimations are not always accurate and the average standard deviation is 5m - 10m (16.4 ft - 32.8ft), but that is enough to succesfully use the measurements.
What is the use of height measurements?
With height estimation we can separate points for better location estimation. For example, points on buildings and bridges are always higher than on the ground or railroads. We can also separate points for tall buildings and bridge pillars.
What is the meaning of absolute and relative height?
Absolute height of the point is estimated from the sea level while relative height is the estimated height of the object measured from the ground.
If I can't select the points, how are they selected and how should the location be interpreted?
The points are selected automatically by our algorithms considering the reflective characteristics of the object. We detect deformation from locations with the highest reflectivity and strongest stability. Each measurement is based on a pixel size of 5m x 20m (16.4ft x 65.6ft). The actual location of a single deforming point can only be determined to be within the pixel.
Can I select the exact measurement points?
No. The point locations are connected with the reflective properties of the object and can't be determined earlier.
How precise is Sille?
With Sille we can detect deformations that are larger than 1mm (0.04in). For single detection the average accuracy (between two image acquisitions) is 6mm - 10mm (0.2in - 0.3in).
The true value of Sille comes with time and trend analysis. With longer periods (about one year) the uncertainty lowers and the average accuracy (between 20 image acquisitions) is 1mm - 2mm (0.04in - 0.08in).
How frequently can Sille give me a new analysis?
Sille analyses rely on the orbits of satellites to capture images of the same location at different times. Depending on where you are a satellite will cycle your location at least every 12 days, with a possible frequency of as little as three days in areas of Europe and Canada.
How can I use Sille?
Sille measures movement of the Earth's surface and can be applied in various industries from civil engineering to environmental studies.
- Infrastructure monitoring
- Earthquake or landslide sites
- Oil/natural gas mining or landfill sites
How do I read a Sille analysis?
Sille uses colored dots to indicate surface displacement or velocity along a designated area. Dots range from warm colors (red, orange, yellow) to cool colors (blue). Warm colors signify negative displacement, while cool colors signify positive displacement. Green areas show little to no displacement.
By using the Draw and Graph features you are able to visualize individual points and how their movements compare.
How does Sille work?
Sille provides users with regular and reliable information about ground motion across the globe. Within the application, users can view satellite data, upload their own historic renditions of data, and request Sille analysis for specific locations.
Sille partners with world-class InSAR scientists to ensure a powerful yet simple application for data analytics, comparisons, reporting and visualizing.
Why Sille?
- Ground & infrastructure displacement measurements
- Visualization tools
- Interactive data exploration
- Best practices
- Frequent updates